
Predictive maintenance AI for UK manufacturing

Keep your production line running smarter

Every minute of unplanned downtime costs money. What if you could spot the warning signs days ahead, protect yield, and keep your supply chain moving without drama?

40% Potential reduction in unplanned downtime within six months.
72 hrs Typical early warning window for failure anomalies.
1 consultant Dedicated manufacturing analytics specialist on every project.
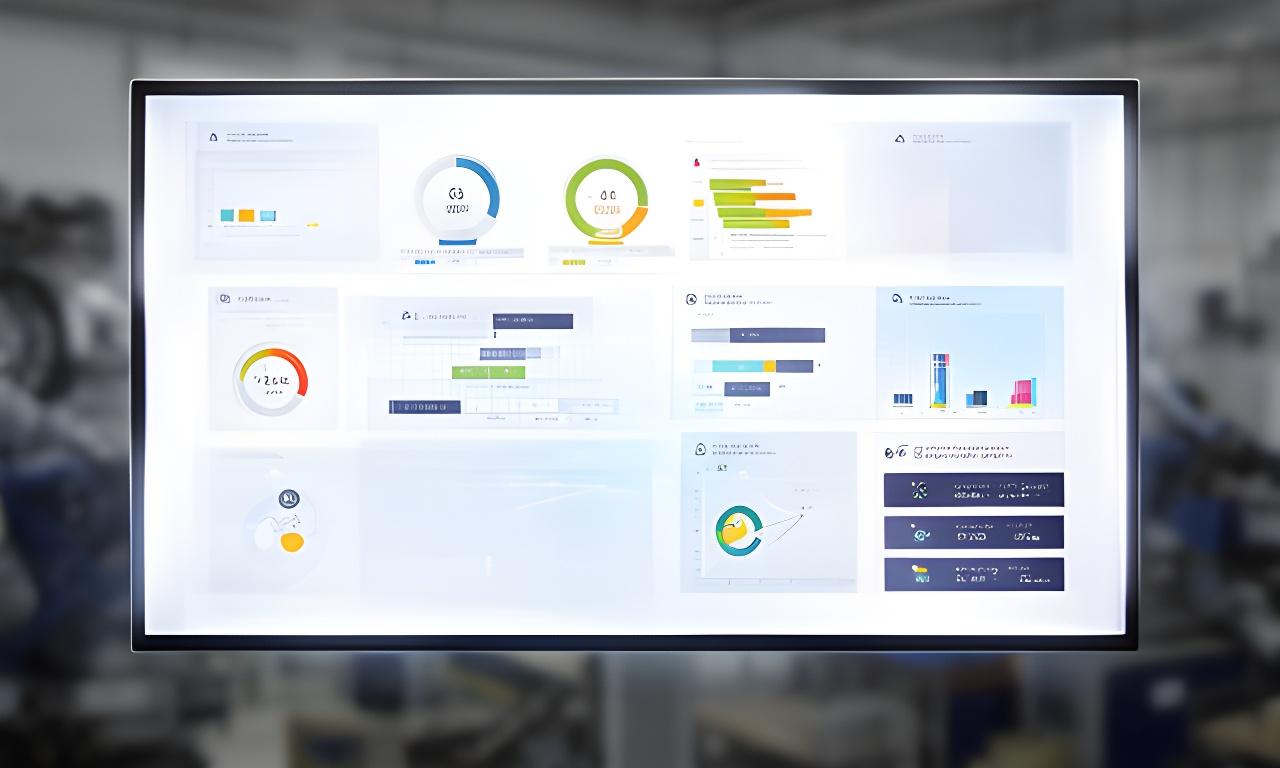
Factory control room with a predictive maintenance dashboard glowing on large screens, showing equipment status and production trends
Live status, not guesswork

Predictive maintenance AI for UK manufacturers

We turn sensor data, PLC signals, SCADA feeds, and production logs into clear decisions. Why wait for a breakdown when the pattern is already there?

Failure prediction that reads the machine, not the calendar

Our model watches vibration, temperature, load, and operator events, then flags the assets most likely to fail. That means maintenance happens when it should, not when the line is already down.

Need a clearer schedule? You’ll see risk bands, remaining useful life, and confidence scoring in one place.

Yield optimisation by shift and batch

Track OEE, scrap rates, and root causes without digging through spreadsheets.

Shop-floor IoT and ERP integration

Connect PLC/SCADA, SAP, Oracle, and transport systems into one live operational view.

Spare parts intelligence

See what’s likely to be needed before the work order lands. Why scramble for bearings at 2 a.m.?

Maintenance scheduling

Cluster tasks, reduce shutdowns, and align interventions with production gaps.

Energy use analytics

Spot inefficient lines and power-hungry assets before they quietly eat margin.

Dashboard preview

A factory floor view that’s easy to act on

The preview is built like a control room briefing: big signals first, then the drill-down. How else would a production manager want it?

Winding line A
Remaining useful life: 18 days
Healthy
Loom cluster 3
Vibration drift detected
Watch
Packaging cell 2
Bearing temperature anomaly
Urgent
Interactive manufacturing dashboard with equipment health indicators, yield charts, and supply chain status cards

Equipment failure prediction

Hover-ready risk indicators show which machine is drifting, what changed, and how soon action is needed.

Yield rate analytics

Shift, operator, and material-lot views help you isolate the root cause behind low-output spikes.

Deep-dive analysis

Maximise every batch with AI yield analytics

A dip in yield is rarely random. Temperature, pressure, material lot, machine age, and operator shift can all tell a different story. Ready to see which one matters most?

Root-cause drill-down

Clicking a low-yield spike expands the contributing factors.

Interactive demo
Shift 1 +3.8% yield
Stable pressure, normal heat range, consistent operator handover.
Shift 2 -4.2% yield
Temperature drift and a slowing feeder motor drove the drop.
Shift 3 +5.1% yield
Fresh calibration and revised maintenance timing restored output.

What if the signal is subtle?

That’s where the model helps. It catches small pattern shifts before they become scrap, rework, or another emergency callout.


One Yorkshire textile mill used the same approach to identify a misaligned loom and lifted fabric yield by 8%. Could your site do the same?

Visibility across the chain

End-to-end supply chain visibility

Maintenance issues rarely stay in one department. They hit inbound materials, inventory planning, and dispatch too. Why not connect the dots before bottlenecks pile up?

Supplier performance scorecard

Track delivery times, quality rates, and cost pressure across your supplier base.

Inventory reorder suggestions

AI highlights parts that should be replenished now, not after a line stoppage.

Inbound transport tracking

Follow material movements so production, warehousing, and logistics stay aligned.

Case study

How a Yorkshire textile mill eliminated 22 hours of downtime a month

Ageing machinery, unpredictable stoppages, and expensive callouts were eating into output. Sound familiar?

Challenge

Unplanned stoppages were becoming routine, and the team had no reliable warning system.

Solution

We connected IoT sensors and a predictive dashboard that flagged vibration anomalies 72 hours before failure.

Result

The site saved 22 hours every month and cut annual maintenance costs by £45,000.

Textile production line with engineers reviewing a maintenance timeline beside looms and sensor readouts
Voice of the factory floor

“The dashboard didn’t just predict failures. It changed how we plan maintenance. We’ve moved from reactive to proactive, and the line feels calmer because of it.”

Leigham Siyam, Plant Manager, Northbridge Textiles

Start with a health check

Get a sample dashboard in five days

Tell us about your current maintenance approach, your critical assets, and the pain points you’re seeing. We’ll analyse your top three failure-prone machines and show you what the dashboard can surface. Why delay the first win?

Phone +447777872761
Address Islip Street, London, NW5 2DL, GB
No fluff. Just a practical review and a dashboard sample.