Retail Sales Analytics
Real-time sales tracking, inventory visibility and customer segmentation that keep shelves and forecasts aligned.
Learn moreAI analytics for UK teams
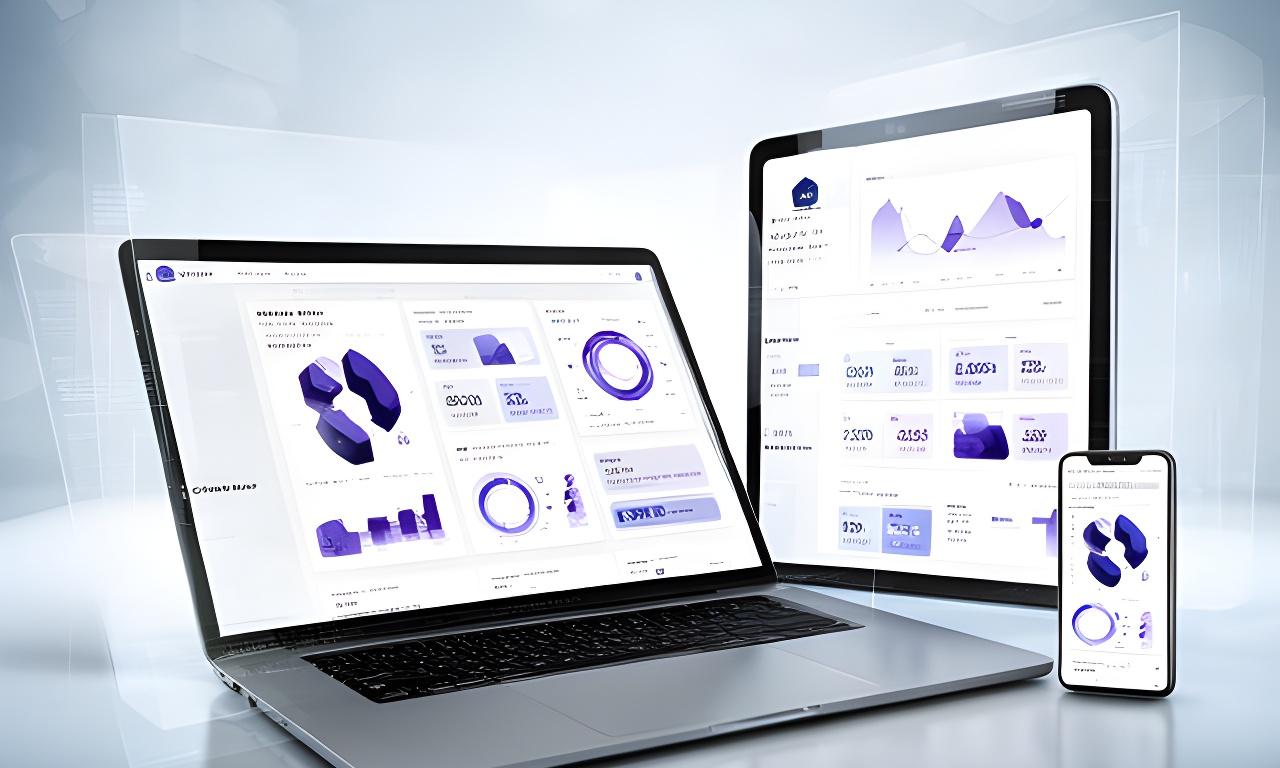
Are you still wrestling with spreadsheets, delayed reports and disconnected systems? Harris Vision builds AI-powered dashboards that bring retail, fintech, healthcare and manufacturing data into one clear view, so your team can move before the market does.
Trusted by UK industry leaders
Need less reporting noise and more decision-ready insight? That is exactly what we design for. Our dashboards reduce manual work, surface risk earlier and make the next action obvious.
Book a free AI dashboard consultationDashboards deployed across the UK.
Data rows processed daily in live pipelines.
Client retention built on measurable outcomes.
Average implementation time for live delivery.
Your data stays protected with UK-aware governance, cloud-native controls and clear access rules. Why make security an afterthought?
We connect the sources, shape the model and ship a working dashboard quickly. No endless discovery cycle. Just momentum.
AI dashboard solutions for every sector
Retail teams need stock clarity. Fintech needs risk signals. Hospitals need faster flow. Manufacturers need predictive maintenance before a line stops. Which pressure point should we solve first?
Real-time sales tracking, inventory visibility and customer segmentation that keep shelves and forecasts aligned.
Learn moreTransaction anomaly alerts, risk scoring and predictive flagging that help your team act before losses mount.
Learn moreAdmission forecasting and bed-flow insight designed to support operational decisions in busy clinical environments.
Learn moreAsset health monitoring, downtime prediction and maintenance prioritisation that protect throughput.
Learn moreOne source of truth for board reporting, margin analysis and fast financial close conversations.
Learn moreRoute intelligence that trims delay, supports service levels and keeps moving parts visible in one place.
Learn moreIndustry-focused insights, tangible results
If the right signal reaches the right person sooner, decisions improve. It really is that simple. We combine live data pipelines, predictive models and visual hierarchy so your team sees the next step, not just the latest chart.
See how it works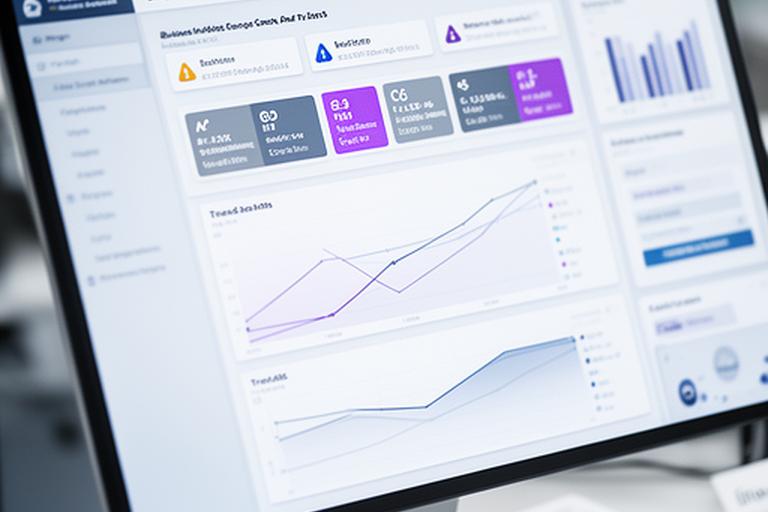
Track sales in real time, spot demand shifts early and tighten inventory decisions before revenue leaks away.
See detailsHighlight unusual transactions, score risk automatically and keep analysts focused on what deserves attention.
See detailsForecast flow, support bed planning and reduce avoidable waiting pressure with clearer operational visibility.
See detailsPredict failure patterns, prioritise intervention and protect production with timely maintenance prompts.
See detailsCalculate your potential savings
The biggest cost is usually hidden in repetition. How many hours are spent reconciling exports, checking numbers and rebuilding charts every month?
Live estimate
Estimated annual savings from reduced reporting time and sharper decisions.
Efficiency gain
Typical improvement when teams replace manual reporting with one governed dashboard.
Success stories from UK businesses
A mid-sized retailer came to us with weekly reporting pain, delayed inventory decisions and inconsistent sales views across stores. We replaced the patchwork with a live dashboard and predictive replenishment alerts. The result? A 35% reduction in inventory cost and far less time spent on manual reconciliation.
Read the full case studyA London startup cut analyst noise and increased fraud detection rate by 42% after switching to model-led alerting.
See detailsA trust improved patient flow and shortened avoidable waits by using better admission forecasts.
See detailsHow we build and deploy your AI dashboard
Want to avoid a long, blurry implementation? Our process keeps each stage visible, accountable and shaped around a real business outcome.
We map your sources, identify bottlenecks and agree the metrics that actually matter. Week 1-2.
Models are wired into your reporting flow so the dashboard can predict, not just describe. Week 2-3.
We shape the interface for speed, clarity and stakeholder trust, then test it with your team. Week 3-4.
Live deployment, training and iterative tuning keep the dashboard useful as the business changes. Week 4 onward.
UK-based AI & data experts
You do not need a giant agency to get a solid result. You need specialists who can think clearly, ship quickly and stay close after launch.

Lead Data Scientist
Combines 17 years in data engineering and forecasting. Calm under pressure. Very useful when a model needs to be explained to a board.

UI/UX Architect
Turns dense data into clean visual stories. The question he asks most often? Can a busy manager understand this in five seconds?

Head of Client Solutions
Keeps the delivery practical, the timelines honest and the stakeholder conversation moving. Because projects stall when nobody owns the next step.
“Harris Vision transformed our monthly reporting — what used to take a week now appears in real time. Why did we choose them? Because they understood the numbers, the workflow and the pressure on our team from day one.”
Leigham Siyam
CFO, mid-sized retail chain
Free AI analytics resources
Need a sharper brief for your internal stakeholders? These resources are built to help you frame the problem, compare options and move the conversation forward.
A practical guide to stock visibility, sales reporting and the KPI choices that help retail teams move faster.
A concise resource on alert design, model governance and the workflow between data science and operations.
A simple tool to estimate time savings, reporting efficiency and the cost of manual decision-making.
Frequently asked questions
Still wondering about security, integrations or training? Good. Those are the right questions to ask before you commit.
Ready to see your data in action?
Book a free, no-obligation consultation with one of our UK-based specialists. We’ll map your goals, review your data and show you where the fastest wins are hiding.